
Printable Z Table Chart
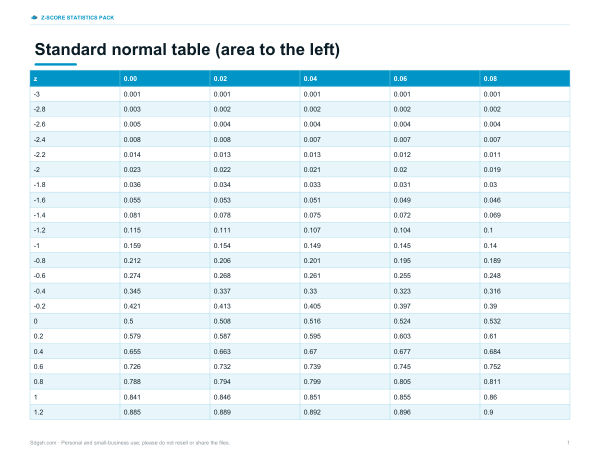
This sheet is for students, teachers, and anyone working with the standard normal distribution. It is a 2-page Letter landscape PDF with a standard normal table showing area to the left of each z value. The columns are labeled z, 0.00, 0.02, 0.04, 0.06, and 0.08. The rows include values such as -3.0, -2.8, and -2.6 with matching probabilities. For negative z values, use the row for the whole number part and add the column value to the magnitude, such as -1.0 and 0.02 to read -1.02.
Free printable · PDF
- 2 pages
- US Letter, landscape — choose “Fit to page” for A4
- PDF, 114 KB
Free for personal, family and classroom use.
Use the table to find cumulative probability for a z score without a calculator. Start with the row for the first two digits, then move across to the column for the hundredths place. Read the value where the row and column meet. The table is useful for checking normal curve areas, solving probability problems, and comparing z scores in statistics work.
Good for
- Find left-tail probability for a z score
- Check normal distribution homework answers
- Read cumulative areas from the standard normal table
Tip: Print landscape at full size so the row and column labels stay easy to read.
4 files · PDF, XLSX, DOCX
Get every sheet: Z-Score Statistics Pack
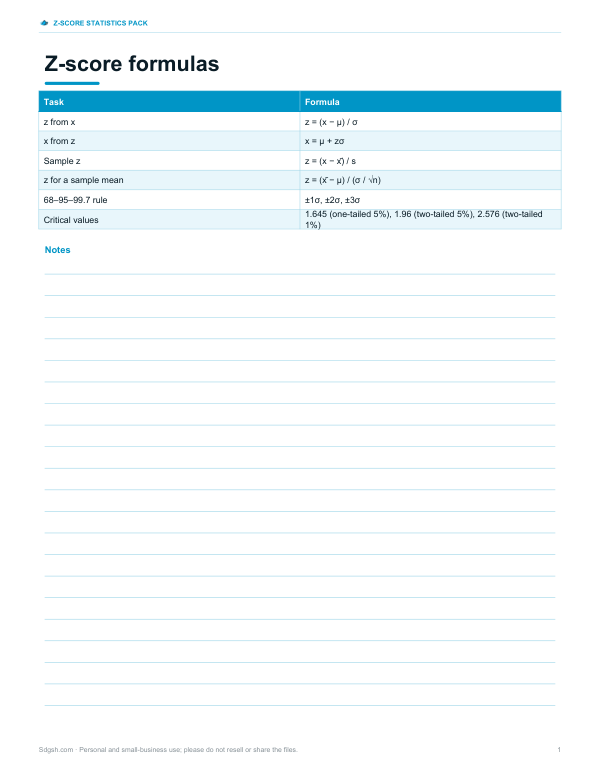
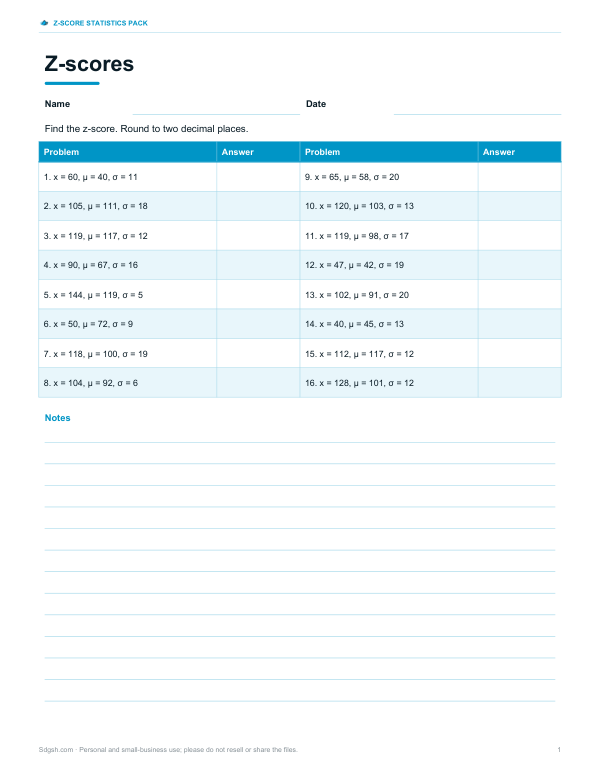
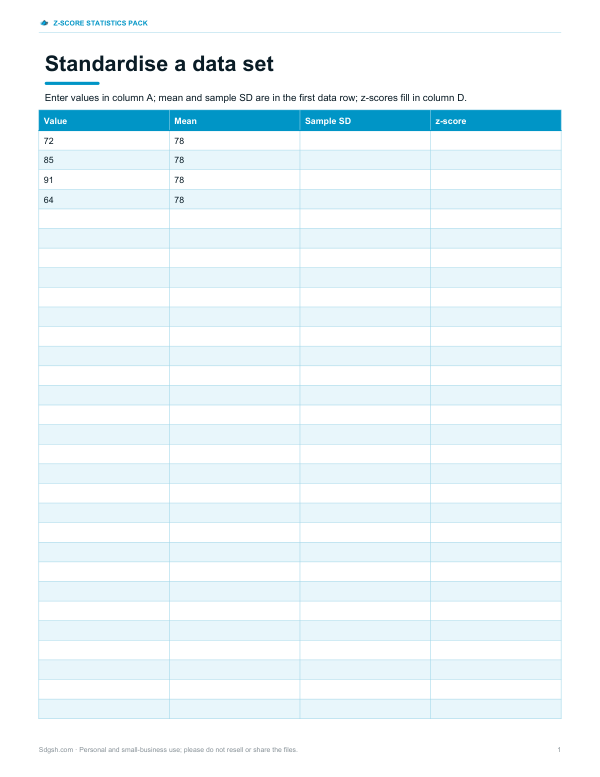
This sheet plus 3 more in one download, with the editable Excel and Word files. Printable statistics study sheets: standard normal (z) table, z-score formula card, practice worksheet with answer key and an Excel template that standardises a data set.
$5.00 USD, one-time 4 files · about $1.25 each
- Instant download
- 7-day refund
- Secure checkout by Stripe
7-day money-back guarantee. Full refund within 7 days of purchase, even after you download.
 Printable Z-Score Formula Card
 Printable Z-Score Practice Worksheet
 Z Score Standardisation Worksheet